Group projects are a good learning experience for advanced students. They invariably generate some tense moments as some team members feel the work and credit are not shared equally. I insist, however on giving the entire group the same grade. The rationale for this is that in many situations, individuals have to learn to work together for the common good. Part of learning to be successful professionally is learning how to deal with people; how to negotiate, how to be assertive without alienating others, how to accept compromise, and how to deal with irrational people (you will certainly encounter plenty of irrational clients). While the outcome is never certain, the saving grace is that such group situations are temporary.
One student approached me before grades were given out on a group project and wanted me to konw that he/she was largely responsible for the work done an the project, and the other team member did not pull his/her weigth. I thanked the student reiterated that it did make any diffference in the grading. It turned out that that projct was one of the higest-rated ones by the professional critquers. Upon reflection, it occured to me, that that kind of group disloyalty is never apprecatiaed and in most cases reflects negatively on the person airing those sentiments.
In short, the most professional approach is to show as few cracks as possible in the group facade. You may vow never to work wtih said individual again; but while the group is working, it the duty of every member to do what is necessay to make it a success. Cajole, encourage, shae, persuade the others to do their part, but alimately, the entire group in in the same boat. Exert leadership if it is necessary, take up the slack if necessary, but the show goes on.
Thursday, November 30, 2006
Portfolio Design Book for Graphic Design and Multimedia Students
We, ( two colleagues and I) are embarking on the writing of a textbook on portfolio development for design students. The contract is already signed with a major publisher, we have an advance, and the clock is ticking on our 18 months unitl deadline! Observations that follow will be some of the rambling precursors to that text. I hope you find some of these pre-publication ruminations amusing or valuable. If that is the case, add a comment to the site. And if you have any experiences you would like to share, or a have a portfolio that you think would be of interest, let me know. We might be able to include it in the book.
Wednesday, November 15, 2006
Drawing as visual communication
Being able to visualize an idea by drawing is a fundamental form of thinking as well communicating. Some simple exercizes that are a part of the foundation typography class develop the fundamental skills that are needed in the advanced assignments like this display design one. Linked here is a pdf of part of the sketch book assignment that includes drawing basic letterforms in space - under the premise of visualizing a theatre entrance. The basic principles and examples are very relevant to any display design assignment. It also, as a bonus, contains some images of kiosks from the Bruce Mau exhibit.
link to pdf
link to pdf


For students working on visualizing exhibition designs, (particularly the group I met with this morning who are addressing the impact of the Olmsteds' work on the urban environment) I wanted to share images of two exhibitions at the Chicago Architectural Foundation, as examples of exhibits that tell stories about Architecture. ( I apologize for not being able to credit the exhibitors or the designers).
Tuesday, November 14, 2006
Visualizing quantities
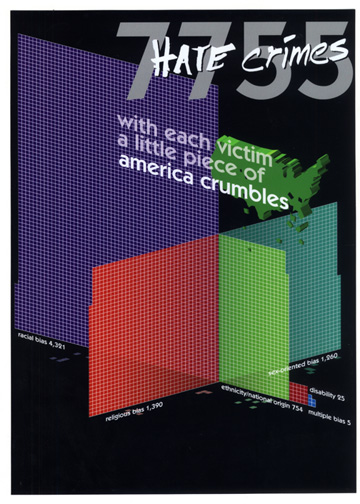
One of the more significant challenges of design is to visualize large quantities or very different numeric values. This example shown below, that depicts the number of hate crimes recorded in the US in 1997 was done at Bradley University several years ago, and is still, to my mind, a good solution, in that it allows the viewer to visually compare the numbers 5, 25, 745, 1390 and 4321, and also depicts each event as an individual mark. It is a statisical chart that also makes an emotional statement.
Subscribe to:
Posts (Atom)